Between 2026 and 2028, Dubai is scheduled to deliver approximately 250,000 residential units — the largest supply surge in the emirate’s history and nearly double the five-year average annual delivery rate. For investors, this number carries two very different interpretations. The unprepared buyer sees risk. The informed buyer sees the most powerful timing tool in Dubai’s current market: a supply clock that, if read correctly, tells you exactly which zones to buy in, which phases to target, and which communities will emerge from the supply peak with the strongest appreciation trajectories.
The Dubai off-plan handover schedule 2026, 2027, and 2028 is not a uniform risk — it is a zone-by-zone, year-by-year calendar of competing supply that varies enormously from JVC (where 7,200+ units arrive in 2027 alone) to MBR City (where Emaar’s master-plan discipline keeps supply controlled and contained). This guide teaches you how to read that calendar — and how to use it as a strategic entry timing advantage before you commit capital.
Reading the Supply Clock: What 250,000 Units Actually Means Year by Year
The headline figure of 250,000 units across 2026–2028 obscures the more important truth: delivery is not evenly distributed. 2026 is the peak. Forecasts predict approximately 99,686 new apartments and 15,284 villas scheduled for that year alone. 2027 moderates to around 70,537 units but remains nearly double Dubai’s historical annual delivery average of 35,531 units. 2028 falls to an estimated 40,000–50,000, representing the first genuine supply deceleration since the 2021–2022 launch cycle began.
But scheduled and actual are different things. Dubai’s construction materialisation rate ran at just 41.3% in Q3 2025 — meaning that fewer than half of units announced for delivery in any given period actually complete on time. For 2026’s 99,686 scheduled apartments, the realistic completion figure is closer to 55,000 units. That is still significant — but it is 45% less than the headline number implies, and it is the actual figure buyers should be modelling against.
The practical consequence of this distinction is critical: the supply clock is slower than it appears. Investors who exit positions or avoid markets entirely based on headline delivery figures are making decisions based on a number that Dubai’s construction reality consistently discounts. This does not eliminate supply risk — it calibrates it. For the complete delivery timeline analysis across 2025–2027, our Dubai property handover schedule and completion timeline analysis provide the most granular zone-level breakdown available.
Table 1: Dubai’s Off-Plan Supply Clock — Year-by-Year Pipeline Overview (2025–2030)
| Year | Units Scheduled | Likely Actual Completions | Highest-Volume Zones | Rental Market Pressure | Buyer Opportunity Signal |
| 2025 | 73,000+ | ~42,500 (58%) | JVC, Business Bay, Dubai Marina, Creek Harbour | MODERATE — absorption ongoing; rental growth slowing | OPEN — still pre-peak |
| 2026 | 99,686 apts + 15,284 villas | ~55,000 (48%) | JVC, Arjan, Dubai South, Azizi Venice, DAMAC Lagoons | HIGH — peak apartment delivery; mid-market most exposed | SELECTIVE — avoid oversupply zones; buy scarcity assets |
| 2027 | 70,537 | ~45,000 (64%) | JVC, Business Bay, Dubai Hills, Creek Harbour, Azizi Venice | ELEVATED — near-double the 5-yr avg; fringe softening likely | STRATEGIC — buy in mature communities; avoid JVC/Arjan |
| 2028 | 40,000–50,000 | ~32,000 (70%+) | Residual 2024–25 launches; new master-community phases | NORMALISING — absorption resuming; supply moderating | RECOVERY WINDOW — phase 1 in 2028 pipeline now |
| 2029–30 | Est. 80,000+ | TBC | New 2026–27 launch completions: Palm Jebel Ali, Blue Waters II | STABILISED — 18–24 months post-peak; appreciation resuming | STRONG — buy 2026 prelaunch for this window |
Sources: Fitch Ratings, Cavendish Maxwell, DLD project data, prelaunch.ae market intelligence. Actual completions reflect historical materialisation rates applied to scheduled volumes.
The materialisation discount: Investors who plan around Dubai’s scheduled handover figures without applying the 41–52% materialisation discount are modelling a market that does not exist. The real 2026 delivery is approximately 55,000 units — still Dubai’s largest single-year completion, but 45% less threatening than the raw figure implies. Apply this discount to every zone analysis you conduct.

The Zone Handover Heat Map: Where Supply Peaks and Where It Stays Controlled
Supply risk in Dubai’s 2026–2028 cycle is intensely localised. The difference between JVC — where over 16,852 apartments are scheduled across 2025–2027 alone — and MBR City — where Emaar’s master-plan control keeps annual supply below 1,600 units — is not a nuance. It is a fundamentally different investment environment. The heat map table below applies a red-amber-green risk rating to Dubai’s nine key investment zones based on their 2026–2028 scheduled handover volumes and structural demand characteristics.
Table 2: Zone Handover Heat Map — 2026–2028 Supply Concentration by Community
| Zone | 2026 Handovers | 2027 Handovers | 2028 Handovers | Peak Supply Risk | Best Phase to Buy NOW For | Verdict |
| JVC | 4,500+ | 7,200+ | 3,500+ | VERY HIGH | 2028–29 handover only; avoid 2026–27 | 🔴 Avoid |
| Arjan / Al Barsha S. | 3,100+ | 2,400+ | 1,200+ | HIGH | 2028 handover; 1-bed only | 🟡 Selective |
| Dubai South | 2,800+ | 4,100+ | 3,200+ | HIGH | Post-2028; airport catalyst timing | 🟡 Wait |
| Business Bay | 2,700+ | 3,400+ | 2,100+ | MEDIUM | 2026–27 if branded/premium only | 🟡 Selective |
| Dubai Hills Estate | 1,800+ | 3,200+ | 1,500+ | LOW | Any phase — buy now at phase 1 | 🟢 Strong |
| Dubai Islands | 1,100+ | 2,400+ | 2,800+ | LOW | 2026–28 all viable; waterfront scarce | 🟢 Strong |
| Creek Harbour | 1,400+ | 2,800+ | 2,000+ | LOW | 2026–27 phase 1 — tallest tower catalyst | 🟢 Buy Now |
| MBR City | 900+ | 1,600+ | 1,200+ | VERY LOW | Any — supply controlled by Emaar | 🟢 Buy Now |
| Palm Jumeirah / Jebel Ali | 400+ | 800+ | 1,500+ | VERY LOW | 2027–28 for Palm Jebel Ali phases | 🟢 Strong |
🔴 Avoid peak-supply zones for 2026–27 handovers.
🟡 Selective entry only with strong unit-type differentiation.
🟢 Strong supply discipline; phase 1 entry recommended.
Sources: DLD pipeline data, prelaunch.ae community analysis.
The JVC red flag deserves direct acknowledgement. With over 16,852 total units scheduled across 2025–2027 — making it Dubai’s single highest-volume delivery zone — JVC’s rental market will face genuine competition for tenants. Vacancy rates, which have historically run at 5–8% in JVC, are likely to soften toward 10–15% during peak delivery in 2027. This compresses both yield and resale liquidity for standard units. Our comprehensive 2026–2028 supply glut navigation guide for avoiding oversupplied areas and finding undersupplied segments maps every vulnerable zone with corresponding strategic responses.
The Strategic Timing Principle: Buy Before Supply Peaks, Handover Into Recovery
Understanding the supply clock unlocks a timing strategy that is available to any informed off-plan buyer but is used systematically by only a fraction of the market. The principle is straightforward:
Buy at phase 1 in a supply-controlled zone today. Handover into the post-peak recovery window of 2028–2030.
A buyer who enters Creek Harbour phase 1 at AED 1,600 per square foot today is buying at the pre-peak price floor of a zone whose supply remains controlled, and whose tallest tower infrastructure catalyst matures through 2027–2028. By handover, the competing supply wave in JVC and Arjan will have crested, absorption will be normalising, and rental demand in Dubai’s mid-to-premium zones will be firming. The investor who timed entry correctly is handing over into a recovering market with a cost base from before the correction.
Conversely, a buyer who purchases phase 2 of a JVC project in Q2 2026 for a 2027 handover is entering at a phase-two markup, in a zone with 7,200+ competing handovers in their delivery year, with a compressed resale timeline and a rental market fighting for tenants across thousands of simultaneous completions. This is not a strategy — it is paying a premium to arrive at the worst possible moment.
The broader macroeconomic case for the recovery window is supported by historical data. Dubai’s previous major supply cycle — the 2019–2020 delivery peak — was followed by 18–24 months of stabilisation and then meaningful appreciation recovery as absorption normalised. Analysts project the 2026–2028 peak to follow a similar trajectory, with price appreciation resuming in well-located communities by 2029–2030. See our analysis of whether the Dubai off-plan boom has peaked and what a market correction means for investors for the full cycle-analysis perspective.
The Timing Matrix: Six Scenarios Mapped Against the Supply Clock
The table below models six distinct buyer scenarios against the 2026–2028 handover calendar, rating each on rental yield outlook, capital growth potential, and a clear buy-now-vs-wait decision — so you can match your own situation to the supply clock reality.
Table 3: The Supply Clock Timing Matrix — Six Buy Scenarios Rated (2026)
| Buy Scenario | Handover Year | Competing Supply at Handover | Rental Yield Outlook | Capital Growth | Decision |
| Phase 1 now — Dubai Hills, Creek Harbour, MBR City (scarce zones) | 2027–2028 | LOW — zone supply controlled; developer master plan limits competition | 6.5–8% — strong | ★★★★★ — pre-peak entry; full appreciation runway | BUY NOW |
| Phase 1 now — JVC studio (high-supply zone) | 2027 | VERY HIGH — 7,200+ competing handovers in the same year | 5–6% — compressed | ★★☆☆☆ — appreciation eroded by competing supply | AVOID |
| Phase 2 now — Dubai South 1-bed | 2028 | HIGH — airport zone absorbing 10,000+ units 2026–28 | 5.5–6.5% — improving | ★★★☆☆ — 2029 airport catalyst may recover | WAIT |
| Phase 1 now — Dubai Islands waterfront 2-bed | 2026–2027 | LOW — island scarcity; no competing waterfront supply | 7–8.5% — premium | ★★★★★ — tourism/rental crossover; Palm comparison upside | BUY NOW |
| Buy 2028 launch for 2030 handover — Palm Jebel Ali | 2030 | VERY LOW — master-plan controlled; Palm scarcity model | TBD — developing zone | ★★★★☆ — long appreciation runway; ground-floor entry | WATCH CLOSELY |
| Phase 1 now — branded residence (hospitality, any zone) | 2027–2028 | LOW — branded supply is a separate market; scarcity by definition | 6–8% — brand premium | ★★★★☆ — brand floor protects in supply-heavy year | BUY NOW |
BUY NOW = phase 1 entry recommended immediately. AVOID = competing supply makes this entry point structurally weak. WAIT = monitor; entry conditions are improving but not optimal yet. Sources: prelaunch.ae analysis.
The most important row in this table is Scenario 1: phase 1 entry today in Dubai Hills, Creek Harbour, or MBR City, for a 2027–2028 handover. This is the supply-clock strategy in its purest form — entering a low-supply zone at the pre-peak price floor, handing over as the broader market’s supply surge crests, and renting or reselling into a demand environment that has been thinning competing stock for two years while yours has been appreciating. For specific projects currently available at phase 1 pricing in these zones, see our guide to the off-plan vs ready property decision in 2027 and where pre-launch discounts deliver maximum returns.
The 48% Completion Rate: Your Built-In Supply Buffer
Every supply analysis of Dubai’s 2026 pipeline should carry a prominent asterisk: only 48% of the scheduled 2026 units are expected to be completed on time. This figure — drawn from DLD project data and historical developer performance tracking — has been consistent across multiple analysis sources and represents one of the most important structural buffers for Dubai off-plan buyers in the current cycle.
The practical implication: the 99,686 apartments scheduled for 2026 delivery will actually materialise as approximately 55,000 completed units. That 45% reduction in actual supply is spread unevenly — large, capitalised developers like Emaar, DAMAC, and Sobha have strong delivery track records (60–75% on-time rates), while smaller and mid-tier developers average significantly lower completion rates. This means the supply pressure is most acute in zones dominated by smaller developers — precisely the zones (JVC, Arjan, Dubai South) already flagged as high-risk in the heat map above.
For investors buying with established developers in supply-controlled master communities, the 48% materialisation rate is less a risk and more a competitive floor: their asset delivers as promised while competing units from less disciplined developers lag — reducing the supply pressure in their zone and supporting the rental market at handover. Understanding which developers actually deliver is covered in our Dubai prelaunch properties 2026 expert guide and 25% gains analysis.
The developer delivery hierarchy: Emaar, Sobha, Nakheel, and DAMAC deliver 60–75% of announced units on or near schedule. Mid-tier developers average 40–55%. Smaller developers can fall below 30%. When evaluating supply competition for your handover window, weight competitor units by developer delivery probability — not all 7,200 JVC units scheduled for 2027 will arrive in 2027.
Dubai South and the Airport Catalyst: When Waiting Is the Right Strategy
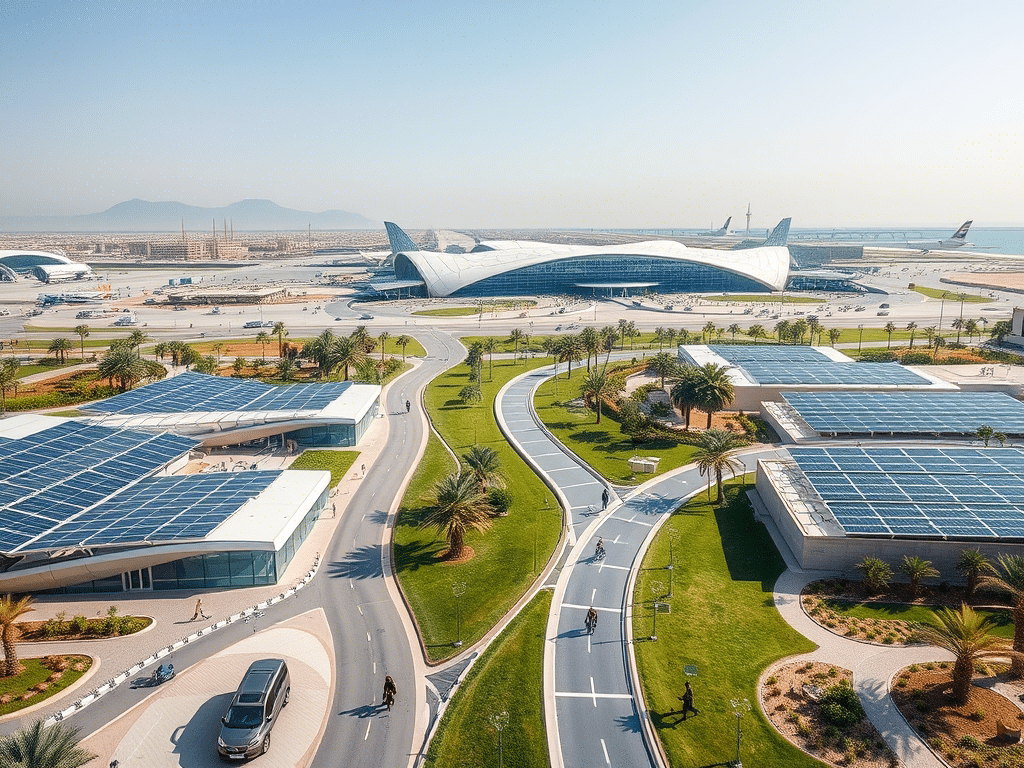
Not every supply-heavy zone should be avoided indefinitely. Dubai South is instructive. With approximately 10,000+ units scheduled across 2026–2028 and infrastructure absorption still maturing, our 2026 Dubai oversupply risk map and safe investment zones analysis flags it as a zone requiring strategic patience — specifically, delaying investment until post-2027 when the initial supply wave absorbs, and the Al Maktoum International Airport catalyst begins driving rental demand in earnest.
The airport’s Phase 1 capacity target of 26 million passengers — and its long-term ambition to become the world’s largest airport — will eventually make Dubai South a structurally demand-rich zone. But the timing of that demand influx and the current supply pipeline are not yet synchronised. Early-entry investors in Dubai South accept 2–3 years of softer yields before the infrastructure catalyst activates. Late-entry investors — those who wait for the airport catalyst to be publicly confirmed and priced in — will pay the post-catalyst markup. The optimal window is between those two points: after initial supply absorption (2028+) but before the airport premium is fully priced into resale values.
Conclusion: The Clock Is Ticking — But It Is Ticking in Your Favour If You Know How to Read It
Dubai’s 250,000-unit handover pipeline through 2028 is the defining market variable of this investment cycle. It creates genuine risk in over-supplied zones and for buyers who time their entry poorly. But for investors who understand that the supply clock is zone-specific, developer-adjusted, and materialisation-discounted, it is something else entirely: a precision timing tool that tells you exactly where to buy, in which phase, and at which handover window.
Buy in a supply-controlled zone at phase 1 today. Hand over into the 2028–2030 recovery window. Own an asset that was purchased before the supply peak and delivered after it. That is not luck — it is reading the clock.
For a complete view of how the supply clock interacts with investor rotation between Dubai, Abu Dhabi, and Ras Al Khaimah in the same period, see our analysis of why some investors are rotating from Dubai to Abu Dhabi in 2027 based on real supply versus population data.
Buy Before the Supply Clock Runs Out
Fill up the form on our website at prelaunch.ae and let our specialists show you the current phase 1 opportunities in Dubai’s lowest-competition handover zones — with full supply-clock analysis included before you commit.
📞 (+971) 52 341 7272 | ✉ [email protected] | 🌐 prelaunch.ae
The best time to buy ahead of the supply peak is before it arrives. That window is open now — and it is zone-specific.
Frequently Asked Questions
How many units is Dubai actually going to deliver in 2026?
Approximately 99,686 apartments and 15,284 villas are scheduled for 2026 completion. Applying Dubai’s historical construction materialisation rate of approximately 48%, the realistic completion figure is closer to 55,000 units. This is still Dubai’s largest single-year delivery on record — but materially different from the headline number in its market impact.
Which Dubai zones should I avoid buying in for 2026–2027 handovers?
JVC carries the highest risk, with over 16,852 units scheduled across 2025–2027. Arjan, Dubai South, and parts of Business Bay also face elevated supply pressure. For investors, the red-flag test is simple: if the zone has more than 3,000 competing units scheduled for the same calendar year as your handover, the rental and resale market will be under significant competing supply pressure.
Where are the lowest-competition handover zones in 2027–2028?
MBR City, Dubai Islands, the Palm cluster, and branded residence projects in any zone carry the lowest competing supply at handover. Emaar-controlled master communities (Dubai Hills, Creek Harbour) benefit from deliberate supply management that limits annual delivery to demand-absorptive volumes — structurally insulating these zones from the mid-market oversupply cycle.
Does the supply clock affect branded residences differently?
Yes — significantly. Branded residences compete in a separate demand pool to standard apartments. A buyer of a Mandarin Oriental or Armani residence is not competing with 7,200 JVC studios for tenants or resale buyers. The branded supply clock runs on different timing and volumes, making branded assets structurally more resilient in peak supply years than non-branded equivalents in the same or adjacent zones.
When is the best time to buy for a 2029–2030 handover?
Now, in a phase-1 launch in a supply-controlled zone. The 2026 prelaunch window for 2028–2030 handover projects is the most strategic entry point in the current cycle: you buy at the price floor before the supply peak, your construction period runs through the peak, and you handover into the post-peak recovery when absorption is normalising, and appreciation is resuming. This is the supply-clock strategy executed at its highest level.