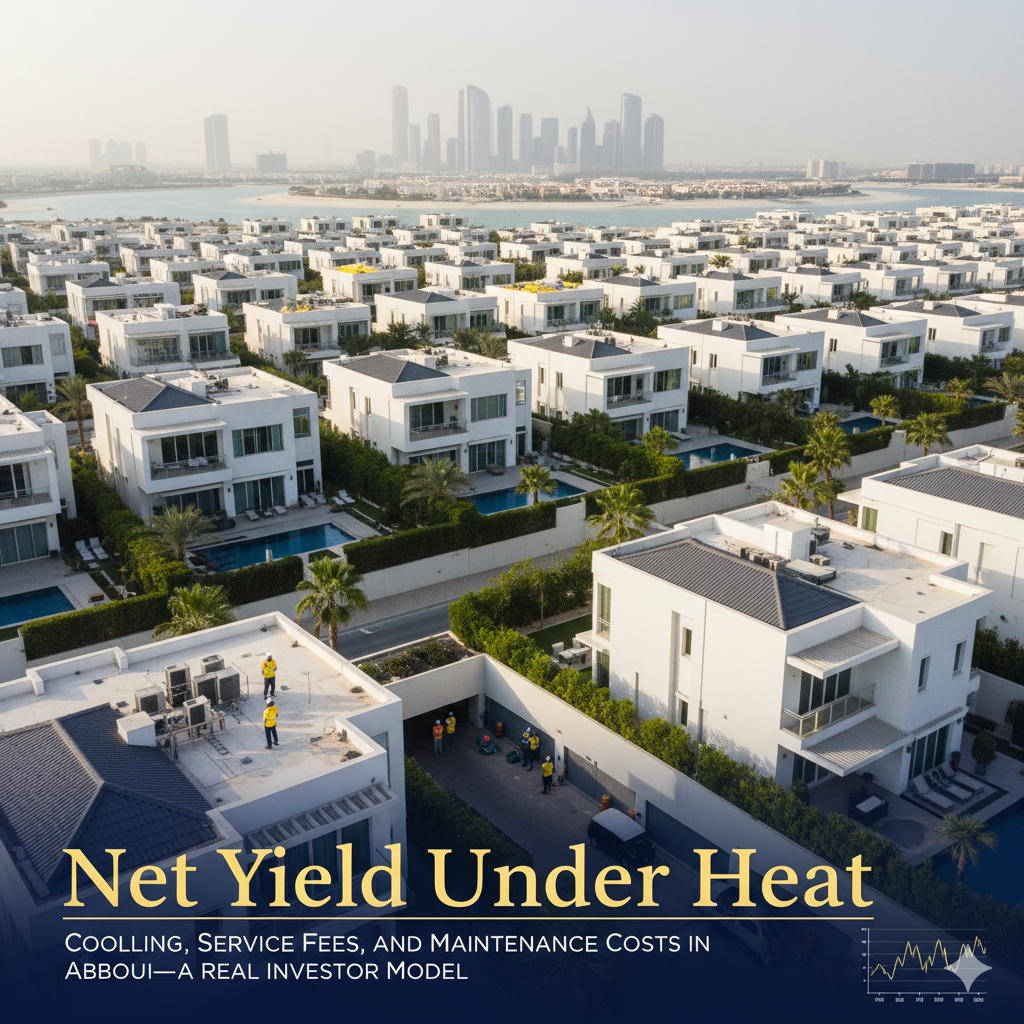
When evaluating Abu Dhabi property investment opportunities, most investors focus exclusively on gross rental yield—the headline percentage calculated by dividing annual rent by purchase price. However, this metric masks a critical reality: hidden operating costs in Abu Dhabi can erode 30-45% of gross rental income, transforming an attractive 7% gross yield into a mediocre 4% net rental yield.
Understanding the complete cost structure of Abu Dhabi properties—particularly cooling charges, service fees, and maintenance expenses—separates successful long-term investors from those experiencing disappointing cash flows. This comprehensive analysis provides a real-world investor model exposing the true economics of Abu Dhabi rental properties.
The Gross vs. Net Yield Gap: Why Headlines Deceive
Gross rental yield represents the simplistic calculation:
Formula: (Annual Rent ÷ Purchase Price) × 100
Example:
- Purchase price: AED 1.2 million (2BR apartment)
- Annual rent: AED 85,000
- Gross yield: 7.08%
This figure appears compelling compared to global averages (London ~3%, New York ~4.5%), but net yield—the actual return after operating expenses—tells a dramatically different story.
Net Rental Yield Formula: [(Annual Rent – Operating Costs) ÷ Purchase Price] × 100
Using the same property with realistic Abu Dhabi operating costs:
- Annual rent: AED 85,000
- Operating costs: AED 28,500 (33.5% of rent)
- Net annual income: AED 56,500
- Net yield: 4.71%
This 2.37-percentage-point gap between gross and net yields compounds over time, significantly impacting total returns and investment decisions.
The Three Cost Pillars Destroying Abu Dhabi Yields
1. Cooling Charges: The Silent Yield Killer
Unlike most global markets, where tenants pay utilities directly to providers, Abu Dhabi’s district cooling system creates unique cost structures where landlords often bear responsibility.
District Cooling Explained:
Abu Dhabi employs centralized chilled water systems serving entire communities or buildings. Companies like Tabreed produce and distribute cooled water through underground pipes, charging based on consumption (measured in Refrigerant Tons or RTH).
Landlord vs. Tenant Responsibility:
The critical question determining investor profitability: who pays cooling costs?
Scenario A: Landlord Pays Cooling (Common in Many Buildings)
| Unit Type | Annual Cooling Cost | % of Typical Rent |
| Studio (400 sq.ft) | AED 6,000-8,000 | 12-16% |
| 1BR (700 sq.ft) | AED 9,000-12,000 | 14-18% |
| 2BR (1,100 sq.ft) | AED 14,000-18,000 | 16-21% |
| 3BR (1,600 sq.ft) | AED 20,000-26,000 | 18-24% |
Scenario B: Tenant Pays Cooling (Investor-Favorable)
Operating costs: Zero cooling burden on the landlord. Yield impact: Improves net yield by 1.5-2.5 percentage points
Critical Due Diligence: Before purchasing, verify tenancy contract norms in the specific building/community. Buildings constructed pre-2015 often have landlord-pays-cooling clauses embedded in original sales agreements, regardless of individual investor preferences.
Regional Comparison:
In developments emphasizing infrastructure-driven value like certain Dubai South properties near major employment hubs, newer buildings increasingly adopt DEWA direct billing or individual cooling meters, shifting costs to tenants and protecting investor net yields.
2. Service Charges: The Escalating Fixed Cost
Annual service charges fund common area maintenance, security, landscaping, amenity operations, and building management. Unlike cooling (variable based on consumption), service charges represent fixed costs regardless of whether units are occupied or vacant.
Abu Dhabi Service Charge Structure:
Calculated per square foot, typically billed quarterly or annually by building management companies or homeowner associations.
Market Rates by Community Type (2024-2025):
| Community Type | Service Charge (AED/sq.ft/year) | 2BR Example (1,100 sq.ft) |
| Premium Islands (Saadiyat, Yas) | AED 18-28 | AED 19,800-30,800 |
| Mid-Tier Communities (Reem, Raha) | AED 12-18 | AED 13,200-19,800 |
| Mainland Affordable (Reef, Baniyas) | AED 8-14 | AED 8,800-15,400 |
| Luxury Developments (Nareel) | AED 25-35 | AED 27,500-38,500 |
Hidden Escalation Clauses:
Many Homeowners Association (HOA) agreements include 5-8% annual escalation tied to inflation or rising labor costs. A service charge starting at AED 15/sq.ft can reach AED 22/sq.ft within 5 years, compressing yields progressively.
Investor Protection Strategy:
Request historical service charge data (5-year trend) before purchase. Communities showing controlled escalation (2-3% annually) indicate professional management; those with erratic increases (10-15% spikes) suggest poor cost control or deferred maintenance, creating future assessment risks.
3. Maintenance & Repairs: The Unpredictable Wildcard
While cooling and service charges are predictable, maintenance costs vary based on property age, tenant behavior, and building quality.
Annual Maintenance Budget (Conservative Model):
Investor-Paid Maintenance (Standard Tenancy Terms):
- Major appliance replacement reserve: 1-2% of property value annually
- Minor repairs (plumbing, electrical): AED 2,000-4,000/year
- HVAC servicing: AED 1,500-2,500/year (if individual AC units)
- Painting/refresh between tenants: AED 3,000-5,000 every 2-3 years
- Emergency repairs: AED 1,000-3,000/year contingency
Total Annual Maintenance: AED 7,500-14,500 (varies by property age and tenant quality)
Age-Based Maintenance Curve:
| Property Age | Annual Maintenance (% of Value) | Rationale |
| 0-3 years (New) | 0.5-1.0% | Developer warranty coverage, minimal issues |
| 4-7 years (Mature) | 1.5-2.0% | Appliances reaching the end of warranty, normal wear |
| 8-15 years (Aging) | 2.5-3.5% | Major systems requiring replacement (AC, water heaters) |
| 15+ years (Dated) | 3.5-5.0% | Comprehensive refurbishment needed, structural issues |
Strategic Implication: New off-plan properties offer 3-5 year maintenance advantages over secondary market purchases, improving net cash flows during initial holding periods. This factor partially justifies new development premiums vs. resale properties.
For investors evaluating phased communities with controlled releases, early phases often experience lower maintenance costs due to newer infrastructure compared to later phases in aging developments.
Complete Investor Model: 2BR Apartment in Premium Location
Assumptions:
- Location: Saadiyat Island, beachfront community
- Property type: 2-bedroom apartment, 1,100 sq.ft
- Purchase price: AED 2.2 million
- Purchase year: 2025
- Analysis period: Year 1 operations (2026)
Revenue Side:
Gross Annual Rent: AED 140,000 (6.36% gross yield)
- Monthly rent: AED 11,667
- Payment structure: 4 cheques (standard Abu Dhabi)
- Security deposit: AED 11,667 (held, not counted as income)
Expense Side:
1. Cooling Charges (Landlord Pays):
- Annual cost: AED 16,000 (mid-range for 1,100 sq.ft)
- Percentage of rent: 11.4%
2. Service Charges:
- Rate: AED 22/sq.ft (premium community)
- Annual cost: AED 24,200
- Percentage of rent: 17.3%
3. Property Management (If Outsourced):
- Rate: 5% of annual rent (market standard)
- Annual cost: AED 7,000
- Services included: Tenant sourcing, rent collection, maintenance coordination
4. Annual Maintenance Reserve:
- Property age: New (Year 1)
- Reserve: 1% of value
- Annual cost: AED 22,000
- Note: May not be fully spent in Year 1, but prudent to reserve
5. Insurance:
- Building insurance: Included in service charge
- Contents/landlord protection: AED 1,500/year
- Coverage: AED 50,000 landlord contents, loss of rent coverage
6. Municipal Tax:
- Abu Dhabi: Currently no property tax for individual investors
- Cost: AED 0
- Note: May change; Dubai imposes 5% municipality fee on commercial only
7. Vacancy & Bad Debt Provision:
- Market vacancy rate: 5-8% in premium segments
- Provision: 5% of gross rent
- Annual cost: AED 7,000
- Rationale: Covers 2-3 weeks between tenancies + potential non-payment
Total Annual Operating Expenses: AED 77,700
Net Operating Income (NOI):
Calculation:
- Gross rent: AED 140,000
- Total expenses: AED 77,700
- NOI: AED 62,300
Net Rental Yield: (AED 62,300 ÷ AED 2,200,000) × 100 = 2.83%
Yield Compression: Gross 6.36% → Net 2.83% = 55.5% cost burden
Mortgage Impact Analysis (If Financed):
Financing Assumptions:
- Down payment: 25% (AED 550,000)
- Loan amount: 75% (AED 1,650,000)
- Interest rate: 4.5%
- Loan term: 25 years
- Monthly payment: AED 9,170
- Annual debt service: AED 110,040
Leveraged Cash Flow:
- NOI: AED 62,300
- Debt service: AED 110,040
- Annual cash flow: -AED 47,740 (negative)
Cash-on-Cash Return: (Negative cash flow makes this metric N/A)
Investor Reality: The property operates at negative cash flow if financed at typical terms. Investment thesis relies entirely on capital appreciation, not rental income—a critical distinction many Abu Dhabi investors overlook.
Alternative Strategy: Properties with tenant-paid cooling and lower service charges (AED 12-15/sq.ft) can achieve breakeven or slight positive cash flow even when leveraged, creating more resilient investment profiles.
Cost Optimization Strategies for Higher Net Yields
Strategy 1: Cooling Cost Transfer
Approach: Select properties where tenancy norms allow cooling cost pass-through
Implementation:
- Pre-purchase verification: Confirm building allows separate cooling meters/billing
- Lease structure: Explicitly state tenant responsibility in contracts
- Building selection: Newer developments (post-2018) are more likely to support this
Yield Improvement: Shifting AED 16,000 cooling cost to tenant improves net yield from 2.83% to 3.56% (+0.73 percentage points)
Strategy 2: Service Charge Minimization
Approach: Prioritize communities with controlled service charges
Building Selection Criteria:
- Competitive rate: AED 12-16/sq.ft vs. AED 22-28/sq.ft
- Transparent governance: HOAs publishing annual financial reports
- Economies of scale: Larger communities (500+ units) often have lower per-unit costs
- Essential amenities only: Avoid over-amenitized buildings with expensive upkeep
Yield Improvement: Reducing service charge from AED 22/sq.ft to AED 14/sq.ft saves AED 8,800/year, improving net yield to 3.23%
Trade-off Consideration: Lower service charges often mean fewer premium amenities, potentially impacting rental demand. Assess whether comprehensive amenities justify higher operating costs through rent premiums or lower vacancy.
Strategy 3: Direct Tenant Management
Approach: Self-manage properties to eliminate 5% management fees
Requirements:
- Local presence: Ability to show units, coordinate repairs
- Time availability: 3-5 hours monthly for tenant relations
- Knowledge: Understanding of Abu Dhabi tenancy laws, maintenance networks
Yield Improvement: Saving AED 7,000 management fee improves net yield to 3.15%
Risk Assessment: Poor self-management can lead to extended vacancies (10-15%) costing far more than professional management fees. Only viable for experienced investors with an Abu Dhabi presence.
Strategy 4: New-Build Purchase
Approach: Buy new off-plan properties to minimize maintenance costs for 3-5 years
Advantages:
- Developer warranties: 1-2 years covering major systems
- Modern systems: Energy-efficient cooling reduces consumption costs
- Lower initial maintenance: 0.5-1% of value vs. 2-3% for older properties
Yield Improvement: Reducing annual maintenance from AED 22,000 to AED 11,000 (0.5% vs. 1%) improves net yield to 3.33%
Strategic Note: Evaluating payment plan flexibility, like a 60/40 structure,s allows investors to minimize capital deployed during construction while targeting new properties with lower operating costs.
Comparative Analysis: Abu Dhabi vs. Dubai Net Yields
| Expense Category | Abu Dhabi Average | Dubai Average | Advantage |
| Cooling (Landlord-Paid) | 15-20% of rent | 8-12% of rent (DEWA direct is more common) | Dubai |
| Service Charges | AED 12-25/sq.ft | AED 8-18/sq.ft | Dubai |
| Property Management | 5-7% of rent | 5% of rent | Neutral |
| Maintenance (New) | 1-1.5% of value | 1-1.5% of value | Neutral |
| Municipal Tax | None | 5% commercial only | Abu Dhabi |
| Typical Net Yield Gap | 2.5-3.5% below gross | 2.0-2.5% below gross | Dubai |
Conclusion: Dubai’s more favorable utility structures and lower service charges create superior net yields on comparable properties, partially explaining stronger investor demand.
The Hidden Tax: Opportunity Cost of Capital
Beyond direct operating costs, Abu Dhabi investors face opportunity costs from capital tied up in properties generating low net yields.
Scenario Analysis:
Option A: Abu Dhabi Premium Property
- Capital invested: AED 550,000 (25% down payment)
- Net annual income: AED 62,300
- Annual mortgage payments: AED 110,040
- Net cash flow: -AED 47,740
- Return on invested capital: Negative (relying on appreciation)
Option B: Alternative Investment (UAE Stock Market)
- Capital invested: AED 550,000
- Average annual return: 8-10% (historical ADX/DFM performance)
- Annual income: AED 44,000-55,000
- Liquidity: High (can sell within days)
Option C: Fixed Deposits
- Capital invested: AED 550,000
- Current rates: 4.5-5.5%
- Annual income: AED 24,750-30,250
- Risk: Minimal (bank guarantee)
Investor Insight: Abu Dhabi real estate generating negative cash flow must deliver 8-12% annual appreciation just to match alternative investment returns. This underscores why net yield analysis is critical—properties must justify their total cost burden through substantial appreciation potential.
Real Investor Success Model: Cash-Flow-Positive Example
Property Profile:
- Location: Al Reef, mainland Abu Dhabi
- Type: 2-bedroom apartment, 1,050 sq.ft
- Purchase price: AED 900,000
- Purchase strategy: Cash (no financing)
Revenue:
Annual rent: AED 65,000 (7.22% gross yield)
Expenses:
- Cooling: AED 0 (tenant-paid building with individual meters)
- Service charges: AED 13,650 (AED 13/sq.ft)
- Property management: AED 3,250 (5%)
- Maintenance reserve: AED 9,000 (1% of value)
- Insurance: AED 1,200
- Vacancy provision: AED 3,250 (5%)
- Total expenses: AED 30,350
Net Operating Income:
NOI: AED 65,000 – AED 30,350 = AED 34,650
Net Rental Yield: (AED 34,650 ÷ AED 900,000) × 100 = 3.85%
Why This Works: ✅ Tenant-paid cooling eliminates 15-18% cost burden
✅ Moderate service charges in efficiently-managed community
✅ Affordable entry price, improving yield mathematics
✅ Cash purchase, avoiding negative leverage
✅ Mainland location sacrificing some appreciation for cash flow
Investment Thesis: This profile suits income-focused investors prioritizing positive monthly cash flow over maximum capital appreciation—a defensive strategy during uncertain economic periods.
The Net Yield Imperative
Abu Dhabi property investment demands rigorous financial modeling that penetrates beyond headline gross yields to expose true net operating income. The emirate’s unique cost structures—particularly district cooling systems, premium service charges, and ongoing maintenance—create expense burdens that can devour 30-50% of rental income.
Successful Abu Dhabi investors:
✅ Calculate net yields before making offers
✅ Verify cooling responsibility in building contracts
✅ Analyze service charge trends over 5+ years
✅ Budget realistically for maintenance based on property age
✅ Factor financing costs honestly (accepting that many properties run negative cash flow)
✅ Compare alternatives (Dubai, secondary Abu Dhabi locations, other asset classes)
The Bottom Line: An Abu Dhabi property advertised at “7% gross yield” might deliver 3-4% net yield after all operating costs—still attractive if accompanied by 5-8% annual appreciation, but disappointing if treated as pure income investment.
Professional Net Yield Analysis & Investment Guidance
Accurately modeling Abu Dhabi property operating costs requires access to building-specific data, historical expense trends, and market benchmarking unavailable to individual investors. Professional advisory firms provide the analytical infrastructure necessary for confident investment decisions.
📋 Access our comprehensive Net Yield Calculator at prelaunch.ae:
- Input any Abu Dhabi property to receive detailed expense projections
- Compare net yields across multiple properties and locations
- Download customizable investor models with 10-year cash flow forecasts
- Identify cash-flow-positive opportunities in current market
📞 Consult our Abu Dhabi investment analysts:
- Phone: (+971) 52 341 7272
- Email: [email protected]
Our team provides unbiased net yield analysis across Abu Dhabi and Dubai, helping investors distinguish between marketed returns and actual cash flows. We’ve modeled 200+ buildings across both emirates, documenting which communities offer genuine net yields vs. those hiding unsustainable cost structures.
Gross yields attract attention. Net yields build wealth. Know the difference.
FAQs: Abu Dhabi Net Yield Analysis
Q: How can I verify actual service charge rates before purchasing?
A: Request the HOA financial statement from the seller or building management. This document lists actual charges, reserves, and historical trends. Sellers legally must disclose this in Abu Dhabi property transactions.
Q: Can I negotiate cooling costs into higher rent to offset expenses?
A: Theoretically yes, but market competition limits pricing power. Tenants compare all-in costs across properties; if your rent is 15% higher to cover cooling, they’ll choose cheaper alternatives with tenant-paid cooling.
Q: Do service charges ever decrease?
A: Rarely. Best-case scenario is flat charges year-over-year. Most buildings experience 3-7% annual increases. Buildings showing decreasing charges often signal deferred maintenance creating future special assessment risks.
Q: Should I avoid properties with landlord-paid cooling entirely?
A: Not necessarily. If rental premiums in that location offset cooling costs (premium locations commanding 20-30% higher rents may justify the expense), the investment can still work. Always calculate net yield with all costs factored.Q: How do maintenance costs compare in phased communities?
A: Early phases in well-managed phased developments typically experience lower maintenance costs due to newer infrastructure and proactive building management funded by adequately capitalized HOAs. Later phases may face higher costs if communities mature without proper reserves.